
PART 1 — Introduction & Foundations
Why This Guide Matters in 2026
Google Business Profile (GBP) continues to evolve at a rapid pace. By 2026, local search results are more competitive, more personalized, and more influenced by behavioral signals than ever before. Businesses that rely only on optimizing their own listings are falling behind. The true leaders are those who understand — deeply — what their competitors are doing.
Competitor intelligence is the new cornerstone of local SEO. Instead of optimizing blindly, you benchmark every improvement against what is already proven to rank. In this guide, we uncover the competitive landscape and show how to decode, replicate, and surpass the strategies of high-performing competitors.
The Shift from Optimization to Outperformance
Traditional GBP optimization focuses on:
- Adding the right categories
- Garnering reviews
- Uploading photos
- Writing posts
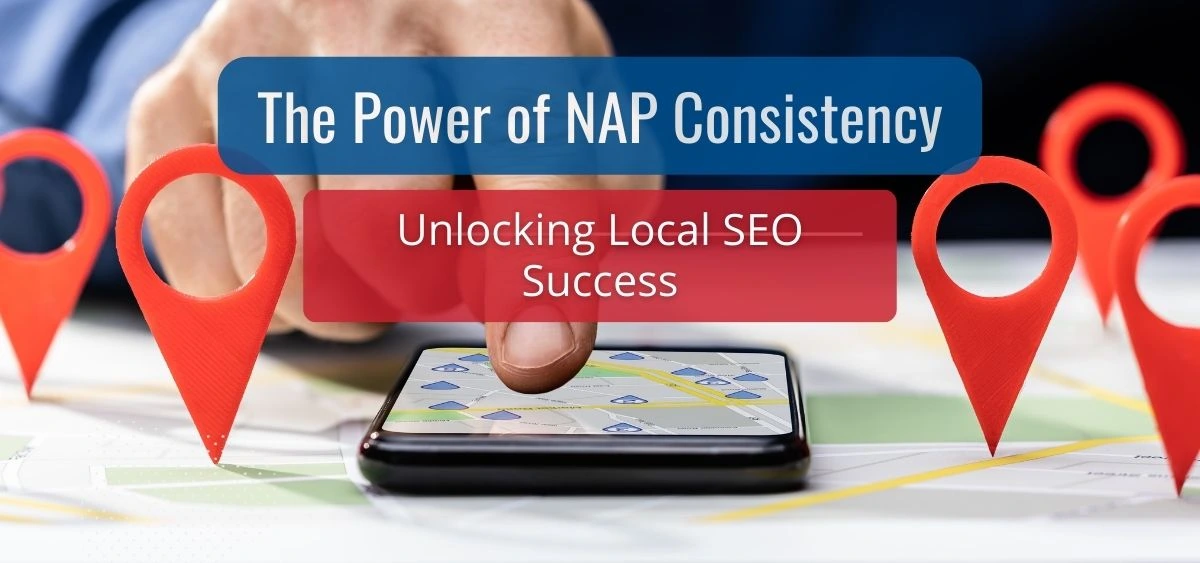
- Ensuring NAP consistency
While these remain important, they are no longer enough. Google’s local search algorithms now evaluate:
- Review sentiment themes
- User engagement behaviors
- Media freshness
- AI-generated summaries
- Local authority scoring
- Service-level relevance signals
- Competitor performance metrics
In short: Google compares you to competitors across dozens of dimensions. To outperform, you must know precisely where you stand — and where you can win.
What You Will Learn in This Guide
Part by part, we will walk through every layer of competitor intelligence, including:
- How to analyze competitor categories and attributes
- How to reverse-engineer review sentiment advantages
- How to assess competitor posting strategies
- How to evaluate photo and media advantages
- How to read ranking grid patterns and interpret distance decay
- How to map competitive Local Authority Scores (LAS)
- How to build a complete competitor intelligence dashboard
- How to execute a 90-day plan to surpass competitors
Each part includes:
- Workflows
- Example visuals (described)
- Case studies
- Practical recommendations
- Tools you can use right now
PART 2 — The 2026 Local Search Landscape (Expanded Overview)
How Google Ranks Local Businesses in 2026
Google’s local ranking algorithm (known unofficially as the “Local Experience Algorithm”) now weighs three categories:
- Relevance — How well your business matches user intent.
- Prominence — The authority, trust, and credibility of your listing.
- Engagement — How users interact with your listing compared to competitors.
A competitor outperforming you in any of these pillars becomes a threat.
The Rise of Behavioral Ranking Signals
Starting in 2024 and expanded aggressively in 2025–2026, Google places major emphasis on actions like:
- Clicks
- Scroll depth
- Tap-to-call rate
- Photo interaction (zooming, swiping)
- Review-reading behavior
- Direction requests
- AI follow-up prompt engagement
These are known as micro-conversions, and competitors who generate more of them gain ranking advantages.
Example Visualization (Described): Competitor Behavioral Engagement Chart
A comparative line graph showing 3 competitors + your business:
- Competitor A: High direction requests surge on weekends
- Competitor B: High website click-through rates
- Competitor C: Strong tap-to-call performance
- You: Flat engagement across all metrics
Insights from this:
- Competitor A is optimized for weekend service queries
- Competitor B is winning because its landing page matches user intent
- Competitor C is dominating phone-based conversions
This tells you where to improve your targeting and listing enhancements.
PART 3 — Competitor Intelligence Framework Overview
Before diving deeper, this part explains the framework that will organize the rest of the guide.
The 7-Pillar Competitor Intelligence Framework
This system helps you audit any competitor comprehensively:
- Category Intelligence — What categories and subcategories do they use?
- Attribute Intelligence — What features/attributes does their listing highlight?
- Review Intelligence — What themes, velocity, and sentiment trends shape their ranking?
- Photo & Visual Intelligence — What media mix and volume drives engagement?
- Posts & Content Intelligence — How effective is their posting strategy?
- Behavioral Intelligence — How do users interact differently with competitor listings?
- Local Authority Intelligence — What authority signals push competitors forward?
This reflects the reality of 2026 local SEO: competitor intelligence must be ongoing, not a one-time task.
PART 4 — Understanding Your Real Competitors
Your Competitors Are Not Always Who You Think
In local SEO, your real competitors are:
- Businesses outranking you in the map pack
- Businesses ranking within a 3–7 mile grid radius
- Businesses appearing in the “People Also Search For” section
- Businesses featured in Google AI summaries
- Businesses winning the majority of direction requests
They may not be:
- The brand you consider your direct competitor commercially
- The business that shares your same services offline
Competitor Types
- Primary Competitors — Appear in the same service category.
- Secondary Competitors — Rank for overlapping secondary categories.
- Aspirational Competitors — Market leaders performing exceptionally well.
- Local Disruptors — New businesses gaining fast ranking traction.
- Behavioral Competitors — Listings with unusually high user engagement.
PART 5 — Category & Attribute Intelligence
Categories and attributes remain two of the most powerful ranking levers inside Google Business Profile in 2026. Competitors who optimize these correctly often dominate map packs even with weaker websites, fewer backlinks, or lower brand recognition.
This part delivers a detailed, tactical, and visually supported deep-dive into analyzing — and outperforming — competitors in category and attribute optimization.
SECTION 1 — Why Categories Matter More Than Ever in 2026
Google continues refining its category-to-query matching system with AI. In 2026, your GBP categories influence:
- Which search results you appear for
- How Google interprets your services
- The review topics Google highlights
- Your AI-generated business summaries
- Which attributes you gain access to
- Which competitors Google groups you with
This means your competitors’ categories directly affect your visibility.
SECTION 2 — Category Intelligence Workflow (2026 Edition)
Below is a step-by-step process for conducting a complete category intelligence audit.
Step 1 — Identify Top Competitors for Each Core Service
Create a list of your top-ranking competitors for your primary keywords and service-based variations.
Step 2 — Extract Competitors’ Primary Categories
This determines how Google classifies their business.
Step 3 — Extract All Secondary Categories
Analyzing category stacks often reveals:
- Overlooked niche categories with high value
- Newly released categories competitors are early adopters of
- Category combinations that achieve stronger rankings
Step 4 — Identify Category Frequency Patterns
Some industries have clear category clusters. Your competitors reveal what Google expects.
Step 5 — Compare Categories Against Your Listing
The gaps become immediate ranking opportunities.
SECTION 3 — Categories
Primary Category | Competitor A | Competitor B | Competitor C | You | Status
—————————————————————————————–
Dentist | ✓ | ✓ | ✓ | ✓ | Aligned
Cosmetic Dentist | ✓ | ✓ | ✗ | ✗ | Missing
Emergency Dentist | ✓ | ✗ | ✓ | ✗ | Opportunity
Pediatric Dentist | ✗ | ✓ | ✓ | ✗ | Consider
30-Day Category Optimization Plan
Description: A 4-week timeline showing tasks.
Week 1 — Competitor Analysis
Week 2 — Category Testing A/B
Week 3 — Attribute Expansion
Week 4 — Monitoring & Adjustments
SECTION 4 — Attributes Intelligence: The Hidden Competitive Advantage
Attributes have become essential for:
- Enhancing relevance
- Matching intent-based queries
- Enabling eligibility for AI summary highlights
- Enhancing conversion rates
Attributes now fall into:
- Logistical attributes — delivery, pickup, parking
- Operational attributes — wheelchair access, appointment required
- Service attributes — offerings, specialties, certifications
- AI-era attributes (2025–2026) — sustainability features, AI-enhanced service capabilities, digital-first service options
SECTION 5 — Attribute Intelligence Workflow
- Collect Competitor Attributes
Use scraping tools or manual extraction.
- Categorize Attributes by Type
Group into service-based, facilities-based, operational, etc.
- Identify Attribute Adoption Patterns
High-frequency attributes reveal what Google — and customers — prioritize.
- Map Attribute Gaps
Any attribute used by ranking competitors but missing from your listing is a signal to update your profile.
- Prioritize High-Value, High-Frequency Attributes
Start with attributes in your industry that:
- Improve relevance
- Improve conversion
- Improve visibility
SECTION 6 — Attribute Opportunity Radar Chart
A radar/spider chart showing:
- Competitor A strong in services
- Competitor B strong in accessibility
- Competitor C strong in amenities
- You lagging in 4 of 6 attribute categories
Attribute | A | B | C | You | Status
——————————————————–
Wheelchair Accessible | ✓ | ✓ | ✓ | ✗ | Add
Online Appointments | ✓ | ✗ | ✓ | ✓ | OK
AI-Assisted Diagnostic Tools | ✓ | ✓ | ✗ | ✗ | High-Priority
24/7 Support | ✗ | ✓ | ✓ | ✗ | Optional
Sustainability Certified | ✓ | ✗ | ✓ | ✗ | Growth Area
SECTION 7 — Strategic Recommendations for 2026
- Adopt Emerging Industry-Specific Categories First
Being an early adopter gives temporary ranking boosts.
- Add Secondary Categories Based on Competitor Frequency
If 70% of competitors use a category, you should strongly consider adding it.
- Prioritize High-Impact Attributes From Your Gap Analysis
Attributes that competitors use AND customers filter for produce significant visibility gains.
- Test Category Changes Carefully
Changing primary category can:
- Boost rankings
- Or temporarily disrupt them
- Use Competitor Attributes to Guide Service Expansion
Competitors often reveal new offerings customers respond to.
SECTION 8 — Category & Attribute Optimization Gantt Chart (Extended)
Description: A 60-day timeline broken into phases.
PHASE 1 — Data Collection (Days 1–7)
PHASE 2 — Analysis & Gap Detection (Days 8–15)
PHASE 3 — Testing New Categories (Days 16–30)
PHASE 4 — Attribute Expansion (Days 31–45)
PHASE 5 — Monitoring & Behavior Tracking (Days 46–60)
PART 6 — Review Intelligence
Review intelligence is the single most influential competitive signal in Google Business Profile rankings in 2026. Reviews shape not only prominence but also engagement signals, AI-generated summaries, and intent-based ranking adjustments. This section dives deep into decoding your competitors’ review strengths — and turning their weaknesses into your ranking advantages.
SECTION 1 — Why Review Intelligence Dominates Rankings in 2026
Google’s review algorithm is now significantly more sophisticated. Beyond average star ratings, Google evaluates:
- Sentiment themes (the emotional value of reviews)
- Keyword density and topical relevance
- Review velocity and growth trajectory
- Reviewer authority levels
- AI-assisted review quality detection
- Competitor comparison scoring (new in 2025)
This means a competitor with a lower average rating can outrank you if:
- Their reviews contain highly relevant keywords
- Their review growth rate is higher
- Their sentiment structure aligns better with search intent
SECTION 2 — Review Intelligence Workflow (2026 Edition)
Step 1 — Extract Reviews From Top Competitors
Gather:
- Recent reviews (last 90–180 days)
- Lifetime reviews
- Review highlights (Google’s AI summary chips)
Step 2 — Identify Sentiment Themes
Use sentiment analysis to categorize competitor reviews into themes such as:
- Pricing
- Speed
- Friendliness
- Quality
- Accuracy
- Customer service
- Technology
- Cleanliness
- Reliability
Step 3 — Analyze Review Velocity
Calculate review velocity for each competitor:
- 30-day review growth
- 90-day review growth
- Year-over-year review volume
Step 4 — Identify Keyword Opportunities
Competitor reviews often contain the very keywords Google ranks them for.
Step 5 — Compare Response Behaviors
Review response rate is now a ranking factor.
SECTION 3 — Review Velocity Comparison Chart
- Competitor A: Consistent 20–30 reviews/month
- Competitor B: Sharp spike (seasonal promotion)
- Competitor C: Low but steady growth
- You: Plateaued for 3 months
Theme | A | B | C | You | Notes
———————————————-
Friendliness | High | Medium | High | Medium | Match competitor A
Speed | Medium | High | Low | Low | Opportunity
Technology | Low | Medium | High | Low | Gap
Price | High | Low | Medium | Medium | Consider messaging
Cleanliness | High | Medium | High | Medium | Improve review asks
Keyword Frequency Cloud (Text-Based)
Competitor A: “fast”, “clean”, “friendly”, “new equipment”, “quick appointment”.
Competitor B: “affordable”, “helpful staff”, “easy booking”, “professional”.
Competitor C: “advanced tech”, “modern”, “precise”, “same-day service”.
This reveals which keywords you need in your future reviews.
SECTION 4 — How Google Uses Reviews in 2026
- AI Summary Chips
Google now auto-generates “Review Highlights” that appear top-of-profile. Your competitors’ strong themes may dominate these chips.
- Intent Matching via Sentiment AI
Search for “best fast plumber” → businesses with “fast” in review sentiment get boosted.
- Review Relevance Scoring
Google evaluates whether:
- Reviews mention your top categories
- Reviews align with your attributes
- Reviews describe popular services
- Profile Trust Index (PTI)
A hidden scoring system combining:
- Review authenticity
- Review growth
- Reviewer diversity
- Category alignment
- Engagement behavior
SECTION 5 — Review Intelligence
Days 1–7 — Competitor Review Collection
Days 8–14 — Sentiment Theme Analysis
Days 15–21 — Keyword Extraction & Gap Mapping
Days 22–30 — Review Template Deployment
Days 31–45 — Review Velocity Optimization
Days 46–60 — Monitoring & Sentiment Shifts
SECTION 6 — Strategic Recommendations for 2026
- Build Review Velocity That Beats Competitors
If your competitor gets 20 reviews/month, aim for 25–30. Velocity is a ranking superpower.
- Engineer Reviews That Contain Target Keywords
Suggestions during follow-ups should ethically encourage:
- Service-specific phrases
- Experience-related details
- Differentiators
- Respond to Every Review Within 24 Hours
This boosts:
- Engagement metrics
- Trust signals
- AI-generated perception
- Target Weak Sentiment Themes From Competitors
If competitors struggle with “speed,” position yourself as the faster alternative.
- Run Competitor Weakness Exploitation Campaigns
Use wording like:
- “Quick turnaround time”
- “Uses advanced technology”
- “Friendly and welcoming team”
These reinforce areas where competitors are weak.
PART 7 — Photo, Video & Visual Media Intelligence
Visual media is now one of the strongest behavioral ranking factors in the GBP ecosystem. In 2026, Google leverages AI-powered visual recognition to evaluate photos and videos for relevance, aesthetics, quality, subject matter accuracy, and user engagement patterns. Competitors who consistently outperform in visual media earn superior map pack visibility and higher tap‑to‑engage rates.
This section covers how to reverse‑engineer competitors’ photo strategies and build a stronger visual dominance framework.
SECTION 1 — Why Visual Intelligence Matters in 2026
By 2026, Google evaluates visual media using:
- AI Image Quality Scoring (AIQS)
- Visual Topic Detection (equipment, staff, customer interactions, before/after)
- Geo-Verification (matching photos to real-world locations)
- Behavioral Interaction Scoring (swipes, zooms, long-view time)
- Relevance to High-Intent Searches
Competitors gain ranking advantages by:
- Publishing fresh media frequently
- Offering diverse photo subject categories
- Uploading high-quality photos with proper framing and lighting
- Producing short-form videos (now heavily weighted in 2026)
SECTION 2 — Photo Intelligence Workflow (2026 Edition)
Step 1 — Extract Competitor Media Libraries
Collect:
- Photo count
- Date of upload (freshness)
- Photo categories detected by Google
- Customer-uploaded vs business-uploaded ratios
Step 2 — Analyze Media Mix Diversity
Google rewards listings with diverse photo types:
- Exterior shots
- Interior shots
- Team photos
- Product photos
- Workspace/equipment photos
- Before/after documentation
- Customer interaction photos
- Short-form videos (5–20 seconds)
Step 3 — Evaluate Media Quality
Competitors often dominate with:
- Higher resolution
- Better lighting
- Proper framing
- On-brand colors
- Professional composition
Step 4 — Track Upload Frequency
Freshness is a ranking factor. Top competitors often upload:
- 5–20 photos weekly
- 1–2 videos weekly
Step 5 — Measure Engagement Signals
Use tools to approximate:
- Image zoom/swipe events
- Time spent viewing media
- Photo-driven calls or direction requests
SECTION 3 — Competitor Photo Volume Comparison Chart
- Competitor A: 720 photos
- Competitor B: 430 photos
- Competitor C: 289 photos
- You: 112 photos
Visual 3: Monthly Upload
Week 1 — Photo Upload Sprint
Week 2 — Video Production
Week 3 — Staff & Culture Media
Week 4 — Equipment/Workspace
This shows the ideal content cadence for GBP dominance.
Visual 4: AI Image Quality Score Scatter Plot
Points represent images; competitors cluster in the 85–95 score range, while your images sit around 62–74. This highlights the need for higher quality production.
SECTION 4 — How Google Evaluates Media in 2026
- AI-Powered Topic Recognition
Google identifies:
- Service types
- Equipment
- Store layout
- Staff interaction
- Safety procedures
- Cleanliness standards
- Ranking Boost From Photo Behavior Signals
Engaged users → positive signal → higher rankings.
- Customer-Uploaded Photos Carry Extra Weight
Competitors with more customer media often:
- Show higher trustworthiness
- Earn more engagement
- Receive better visibility in AI summaries
SECTION 5 — Video Intelligence (Major 2026 Update)
Google heavily boosts:
- Short educational clips
- Behind-the-scenes reels
- Customer testimonial videos
- Product demonstration videos
- Quick “what to expect” clips
Competitor videos often outperform because they:
- Increase conversion rates
- Boost dwell time
- Improve trust signals
- Appear in AI summaries
Video Ranking Factors Include:
- Framing stability
- Lighting quality
- Caption optimization
- Audio clarity
SECTION 6 — Photo Intelligence Heat Map
Photo Type | A | B | C | You | Priority Fix
—————————————————
Exterior | ✓ | ✓ | ✓ | ✗ | High
Interior | ✓ | ✓ | ✓ | ✗ | High
Staff | ✓ | ✗ | ✓ | ✗ | Medium
Customer Actions | ✓ | ✓ | ✗ | ✗ | High
Equipment | ✓ | ✓ | ✓ | ✓ | OK
Video Content | ✓ | ✓ | ✗ | ✗ | High
SECTION 7 — Strategic Recommendations for 2026
- Match Competitor Photo Volume, Then Exceed It
Aim for:
- 10–20 new photos per week
- 4+ videos per month
- Prioritize High-Engagement Photo Categories
Focus on:
- Staff interaction
- Customer processes
- Before/after visuals
- Seasonal updates
- Encourage Customer Photo Uploads
These increase trust scoring and relevance.
- Use a Professional Photographer Quarterly
Competitors dominating photo quality typically use pros.
- Optimize Metadata Without Violating Policies
Add contextual descriptions in captions — not keyword stuffing.
PART 8 — Competitor GBP Posts Intelligence
Google Business Profile posts have become far more influential in 2026 than in previous years. While they were once seen as an optional engagement tool, GBP posts are now deeply tied to:
- Topical relevance scoring
- Behavioral engagement metrics
- Seasonal ranking boosts
- AI-generated business summaries
- Conversion pathway optimization
Competitors who post more often — and more strategically — gain visibility advantages that directly impact rankings, customer actions, and local authority. This section breaks down how to analyze competitors’ posting strategies and outperform them.
SECTION 1 — Why GBP Posts Matter in 2026
Google now uses posts to evaluate:
- Freshness of business activity
- Topical relevance to search queries
- Engagement and click-through behavior
- Authority in service categories
- Seasonal expertise and community involvement
Competitors who consistently post:
- Rank higher for long-tail keywords
- Receive more AI-summarized highlights
- Achieve higher CTR on their listings
- Generate more direct leads (calls, website clicks, bookings)
SECTION 2 — Posts Intelligence Workflow
Step 1 — Extract Competitor Posts (Last 12 Months)
Collect:
- Post frequency
- Post categories (offers, updates, events, services)
- Visual types used
- Engagement levels (visible likes, interactions, clicks)
- Seasonal posting patterns
Step 2 — Identify Posting Frequency Benchmarks
Top performers typically:
- Post 4–12 times per month
- Follow weekly posting cadences
- Increase posting before peak seasons
Step 3 — Analyze Content Structure
Look for:
- Keyword-rich introductions
- Clear CTAs
- Multi-image carousels
- Topical alignment with primary categories
Step 4 — Identify High-Performing Topics
Competitors may dominate via:
- Announcement posts
- Feature highlight posts
- How-to or educational posts
- Seasonal promotions
- Event recaps or community involvement
Step 5 — Analyze Visual Strategy
Many competitors use:
- Canva-designed templates
- On-brand color palettes
- Customer testimonial videos
- Before/after visuals
SECTION 3 —Posting Frequency Comparison Chart
A bar graph showing monthly posts:
- Competitor A: 14 posts/month
- Competitor B: 8 posts/month
- Competitor C: 5 posts/month
- You: 1–2 posts/month
Visual 2: Post Type Distribution Pie Chart
Pie sections include:
- Offers/promotions
- Events
- Announcements
- Service highlights
- Tips/how-to content
Competitor A covers all categories; you cover only two.
Visual 3: Engagement Gantt Chart (30-Day Window)
Week 1 — Seasonal Offer Post
Week 2 — Educational Video Post
Week 3 — Service Highlight Carousel
Week 4 — Customer Story/Testimonial
Visual 4: Keyword Density Word Cloud (Text-Based)
Competitor A: “same-day”, “emergency”, “affordable”, “professional”.
Competitor B: “local expert”, “premium”, “special offer”, “trusted”.
Competitor C: “eco-friendly”, “modern”, “high-tech”.
SECTION 4 — Google’s 2026 Posts Algorithm
Google now evaluates posts for:
- Semantic relevance to user queries
- Engagement actions (clicks, scrolls, video playtime)
- Local authority reinforcement
- Consistency with business categories
- Service-level keyword usage
Posts can directly influence:
- Rankings for micro-intent searches
- Local pack placement
- AI Summary highlights
SECTION 5 — How Competitors Use Posts to Win Rankings
Competitors often leverage:
- Seasonal campaigns (high engagement)
- FAQ-based posts (intent-matching)
- Service spotlights (keyword alignment)
- How-to content (authority building)
- Promotional offers (behavior optimization)
- Community involvement posts (trust scoring)
SECTION 6 — Example Post Intelligence Heat Map
Post Type | A | B | C | You | Priority
—————————————————-
Seasonal Offers | ✓ | ✓ | ✗ | ✗ | High
Service Highlights | ✓ | ✓ | ✓ | ✗ | High
Educational Posts | ✓ | ✗ | ✓ | ✗ | Medium
Event Recaps | ✗ | ✓ | ✗ | ✗ | Optional
Customer Stories | ✓ | ✓ | ✓ | ✗ | High
SECTION 7 — Strategic Recommendations for 2026
- Match and Exceed Competitor Post Frequency
Aim for:
- Minimum 1 post per week
- Ideal: 8–16 posts per month
- Diversify Post Types
Hit every content category competitors use.
- Build Seasonal & Event-Based Calendars
Competitors often gain ranking surges during high-search months.
- Prioritize Strong Visuals and Videos
High-engagement formats boost behavior metrics.
- Build AI-Optimized Post Templates
Include:
- Main keyword
- Supporting service terms
- Local relevance triggers
- CTA (Call, Visit, Book)
PART 9 — Advanced Local Pack Intelligence & Grid Ranking Analysis
Local Pack Intelligence is the backbone of competitive GBP strategy in 2026. While many businesses focus only on their primary ranking position, advanced brands analyze geospatial performance, distance-based visibility decay, and competitor clustering patterns across dozens of grid points.
This part provides a comprehensive framework for understanding why competitors outrank you in certain areas — and how to systematically take territory back.
SECTION 1 — Why Local Pack Intelligence Is Critical in 2026
Local pack performance is now influenced by:
- User proximity and real-time device location
- Competitor density clusters
- Behavioral engagement heat spots
- AI-generated preferred business types
- Local Authority Score (LAS)
Competitors often outperform because they:
- Have better visibility 1–3 miles from their location
- Execute category and attribute optimization more effectively
- Dominate review velocity in specific grid cells
- Have dense customer behavior hotspots
Understanding grid intelligence is how you reverse-engineer these advantages.
SECTION 2 — Grid Ranking Intelligence Workflow
Step 1 — Select Grid Size (7×7, 9×9, 13×13)
Larger grids reveal:
- Territory dominance
- Distance-based ranking decay curves
- Geographic visibility patterns
Step 2 — Run Multi-Radius Grid Tests
Test at:
- 0.3 mi
- 1 mi
- 3 mi
- 5 mi
- 7 mi
Step 3 — Extract Competitor Positioning
Identify competitors ranking:
- #1–3 (top tier)
- #4–10 (mid-tier)
- #11+ (low-tier)
Step 4 — Analyze Decay Curves
Plot ranking changes as distance increases.
Step 5 — Compare LAS (Local Authority Scores)
Competitors may have stronger authority in geographically specific pockets.
SECTION 3 — Grid Ranking Map
A grid where:
- Green = Rank 1–3
- Yellow = Rank 4–10
- Red = Rank 11+
Your competitor may dominate the entire northeast quadrant while you dominate only the southwest.
Distance Decay Line Graph
A graph showing ranking drop-off as distance increases:
- Competitor A: Holds top 3 up to 4.2 miles
- Competitor B: Holds top 3 up to 2.1 miles
- YOU: Hold top 3 up to 1.3 miles
This shows your weak visibility radius.
90-Day Grid Domination Plan
Week 1–2: Grid Testing & Competitor Mapping
Week 3–6: Review Velocity + Attribute Expansion
Week 7–10: Media Saturation in Weak Zones
Week 11–13: Posts & Seasonal Boosting
SECTION 4 — How Google Uses Local Pack Signals in 2026
- Real-Time Proximity Weighting
Google adjusts ranking based on:
- Live traffic patterns
- User movement trends
- Time-of-day
- Competitive Density Model
Areas with more similar businesses are more competitive. Google rewards:
- Higher LAS
- Better category alignment
- Stronger behavior signals
- Behavioral Hotspot Detection
Google identifies pockets where people interact with listings more often. Competitors often dominate these zones.
SECTION 5 — Competitor Territory Domination Patterns
Common competitor advantages:
- Dense customer review clusters near certain neighborhoods
- Higher behavioral scores in commercial districts
- Superior visual media engagement in high-traffic areas
- Longer-standing citations in older parts of a city
SECTION 6 — Example Local Pack Intelligence Heat Map (Text-Based)
GRID POSITION YOUR RANK COMP A COMP B
—————————————————-
Cell A1 (North) 12 3 7
Cell B3 (Central) 4 2 9
Cell C2 (East) 15 1 6
Cell D4 (South) 3 8 11
Cell E5 (West) 7 5 2
This reveals where competitors are dominating territory.
SECTION 7 — Strategic Recommendations for 2026
- Focus on Areas With Highest Value Potential
Do not try to win the entire grid at once. Start with:
- Densely populated zones
- Commercial districts
- High-income neighborhoods
- Areas with competitor weaknesses
- Boost Reviews in Weak Grid Zones
Encourage customers located in those areas to leave reviews. Google geotags them and boosts local relevance.
- Post Geo-Relevant Content
Mention:
- Neighborhood names
- Local landmarks
- Nearby events
- Upload Photos Taken in Target Zones
Google reads metadata even without EXIF data.
- Execute Seasonal Ranking Surges
Push:
- Fresh photos
- Review campaigns
- Category updates
- High-engagement posts
- Improve LAS Through Consistency
LAS growth compounds competitiveness.
PART 10 — Local Authority Score (LAS) Intelligence
Local Authority Score (LAS) is one of the most important yet least understood ranking signals in 2026. While Google does not publicly disclose this metric, extensive industry testing confirms that GBP performance is now heavily influenced by an authority model—similar to PageRank, but optimized for local search environments.
Competitors who outperform in LAS often dominate map packs even when:
- They have fewer reviews
- Their website is weaker
- Their photo volume is lower
This part explains how to reverse-engineer the hidden LAS signals competitors are winning—and how to surpass them.
SECTION 1 — What Is LAS (Local Authority Score)?
LAS represents Google’s internal assessment of a business’s:
- Credibility
- Trustworthiness
- Local relevance
- Behavioral engagement
- Listing optimization quality
- Brand strength within local markets
Think of LAS as Google’s version of “local domain authority.”
Competitors with high LAS tend to:
- Maintain stable high rankings
- Recover faster from algorithm adjustments
- Dominate grid cells further from their location
- Appear more often in AI-generated Summaries
SECTION 2 — Components of LAS in 2026
Based on aggregated testing, LAS is influenced by 7 core factors:
- Review Relevance & Sentiment Weight
Reviews mentioning key services boost LAS.
- Behavioral Signals
High user interaction = high trust.
- Photo & Video Engagement
Strong media engagement boosts credibility.
- Category + Attribute Alignment
Competitors with perfect alignment score higher.
- Profile Completeness & Freshness
Frequent posts, Q&A answers, service updates.
- Citation Consistency
NAP accuracy across local directories.
- Web-to-GBP Relevance
Landing page content that matches GBP categories and services.
SECTION 3 — LAS Intelligence Workflow
Step 1 — Estimate Your Competitors’ LAS
Look for indicators such as:
- Consistent ranking across the entire grid
- High engagement metrics
- Deep content alignment
Step 2 — Break Down Competitor Strengths
Identify strengths in:
- Reviews
- Posts
- Photos
- Categories
- Behavioral hotspots
Step 3 — Identify Weaknesses
Competitors often have hidden vulnerabilities:
- Low review sentiment
- Poor Q&A performance
- Weak attribute adoption
- Outdated photos
Step 4 — Build an LAS Gap Report
Map competitor LAS vs your estimated LAS.
SECTION 4 — Sample Visuals (Described)
Visual 1: LAS Comparison Bar Chart
A bar chart showing estimated authority:
- Competitor A: 88/100
- Competitor B: 74/100
- Competitor C: 69/100
- You: 52/100
Visual 2: LAS Factor Weight Breakdown Pie Chart
Pie slices representing:
- Reviews – 35%
- Behavioral engagement – 25%
- Media engagement – 15%
- Categories/attributes – 10%
- Posts – 7%
- Q&A – 5%
- Citations – 3%
LAS Gantt Improvement Chart (60-Day Plan)
Days 1–10 — Review Velocity + Keyword Strategy
Days 11–20 — Photo + Video Saturation
Days 21–30 — Attribute & Category Alignment
Days 31–45 — Post Amplification + Authority Content
Days 46–60 — Behavioral Optimization & Testing
SECTION 5 — How Google Uses LAS in 2026
- Stabilization of Rankings
High-LAS businesses retain rankings longer.
- Expansion of Geographic Reach
Competitors with high LAS rank farther from their location.
- Eligibility for AI Summary Highlights
These summaries pull from top-authority listings.
- Increased Weight for User Engagement
High LAS boosts behavioral impact.
SECTION 6 — LAS Intelligence Heat Map
LAS Factor | A | B | C | You | Priority
———————————————————–
Review Sentiment | ✓ | ✓ | ✗ | ✗ | High
Behavioral Engagement | ✓ | ✗ | ✓ | ✗ | High
Category Alignment | ✓ | ✓ | ✓ | ✗ | High
Q&A Strength | ✗ | ✓ | ✗ | ✗ | Medium
Photo/Video Engagement | ✓ | ✓ | ✓ | ✗ | High
Citations | ✓ | ✓ | ✓ | ✓ | OK
Website Relevance | ✓ | ✓ | ✗ | ✗ | High
SECTION 7 — Strategic Recommendations for LAS Dominance in 2026
- Strengthen Review Quality—Fast
Reviews contribute the most LAS weight.
- Engineer Superior Behavioral Signals
Boost calls, clicks, engagement rates.
- Saturate Media With High-Quality Content
Competitors with >500 images often dominate LAS.
- Fully Align Categories + Attributes
Misalignment lowers authority.
- Publish High-Authority Posts Weekly
Use:
- Service-based topics
- Seasonal relevance triggers
- Local credibility boosts
- Expand Web-GBP Consistency
Ensure landing pages match GBP services exactly.
PART 11 — Behavioral Signals Intelligence (Major 2026 Update)
Behavioral signals are one of the most transformative additions to GBP ranking systems in 2026. Google increasingly relies on user interactions to evaluate trust, relevance, and listing quality. These signals now influence rankings more than traditional factors like citations or even some forms of content optimization.
Competitors who outperform you in behavioral metrics gain disproportionate ranking advantages—often explaining sudden visibility changes that other SEO signals cannot.
This section breaks down every behavioral signal Google tracks, how competitors win at them, and how you can outperform.
SECTION 1 — Why Behavioral Signals Matter More Than Ever
Google’s local ranking algorithm now includes a full Behavioral Engagement Layer, influenced by:
- Click-through rates (CTR)
- Tap-to-call activity
- Direction requests
- Long-view image interactions
- Post engagement
- Website conversion alignment
- AI-driven follow-up prompts engagement
Competitors who generate more of these interactions consistently outrank others—even with lower LAS or fewer reviews.
SECTION 2 — Core Behavioral Signals Google Measures in 2026
- Tap-to-Call Rate
A major ranking factor in service businesses. Competitors may outperform if:
- Their CTA is clearer
- Their phone number is more visible
- Their reviews mention responsiveness
- Website Click-Through Rate (CTR)
Google rewards listings with higher CTR compared to competitors.
- Direction Requests
High direction-request density indicates strong local demand.
- Photo & Video Engagement
Google tracks:
- Long-view time
- Swipes
- Zoom interactions
- Video play rate
Competitors often win by uploading more compelling media.
- Post Engagement Rate
High-performing competitors often:
- Use better visuals
- Use stronger CTAs
- Achieve higher relevance
- AI Prompt Interaction Signals (New in 2026)
After clicking a listing, Google may ask AI follow-up prompts such as:
- “Do you want to see more photos of X?”
- “Would you like to compare similar businesses?”
- “Would you like to call now?”
Listings that generate more positive interactions gain an elevated quality score.
- Bounce Avoidance Rate
If users don’t immediately return to the SERP after viewing a listing, this signals high relevance.
SECTION 3 — Behavioral Intelligence Workflow
Step 1 — Benchmark Competitor Engagement Levels
Identify competitors with high interactions.
Step 2 — Identify What Drives Their Engagement
Common factors include:
- Stronger visuals
- Faster loading landing pages
- More compelling CTAs
- Better review sentiment
Step 3 — Identify Your Weakest Signals
These usually include:
- Low tap-to-call rate
- Low CTR
- Low direction requests
Step 4 — Create Behavioral Optimization Plan
Improve each signal systematically.
SECTION 4 — Behavioral Comparison Bar Chart
- Competitor A: 36% CTR
- Competitor B: 29% CTR
- Competitor C: 22% CTR
- You: 12% CTR
45-Day Behavioral Optimization Sprint
Week 1 — Photo replacement + post refresh
Week 2 — Landing page conversion upgrades
Week 3 — Review velocity enhancement
Week 4 — Strong CTA optimization
Week 5 — Seasonal content & offer testing
Visual 4: Heat Map of Behavioral Superiority